Transaction monitoring (monitor --apm)
Count every request of a --web service per route and every run of a script, and watch throughput, latency percentiles and error rates in the terminal or on the monitor page, with an on-disk history.
Profiling answers where does this request spend its time? — for
one run, or one request, when you ask. Transaction monitoring answers the
question before that one: which routes and jobs are slow, failing or busy, and
since when? It counts every request a --web service serves, per route, from
the moment the service starts, whether or not anyone is watching, every run
of a script launched through monitor, and — beyond HTTP
— every message a consumer handles and every call an application makes into a
library elephc built; elephc monitor --apm shows them as a
table, a live terminal view, a history on disk, and a Transactions view on the
same monitor page as the profile.
elephc --web --with-monitoring shop.php
ELEPHC_PROBE_ADDR=127.0.0.1:9411 ./shop --listen 0.0.0.0:8080 --apm

elephc monitor 127.0.0.1:9411 --apm --key shop.key \
    --store /var/lib/shop-apm --serve 127.0.0.1:9000
For a script — a cron job, a console command — monitor launches it and
records the run:
elephc monitor bin/console --apm --store /var/lib/shop-apm -- app:import --forceexamples/web-apm/demo.sh runs the service side against a small shop API and
sends it traffic, so you can open the page and watch it fill.
Turning it on
Two things are needed, and both are deliberate:
- The binary carries monitoring:
--with-monitoring, the same build that profiling uses, or--with-apm, which carries transaction monitoring alone. A binary without either — or whose shared counters could not be mapped at startup — refuses--apmwith exit code 2 instead of serving as if monitored while recording nothing. - The service is started with
--apm. It is a runtime argument of the produced binary, not an environment variable: whoever passes a service its arguments already owns it. Without the flag a monitored service counts nothing, exactly as before, andmonitor --apmsays which flag is missing.
This is the one place where the monitoring capability is not dormant until asked. That is the point of monitoring — the incident you need to look at happened before you connected — and it is why it takes an explicit switch.
What is counted
Per route, cumulatively since the service started:
| Counter | Meaning |
|---|---|
| requests | requests that completed |
| status classes | 1xx, 2xx, 3xx, 4xx, 5xx — anything outside 100–599 counts as 5xx |
| wall time | summed, from the request head to the handler’s return |
| latency histogram | 256 buckets, exact below 16 µs, then 8 per power of two |
| database | statements executed, and nanoseconds blocked in database drivers |
| network | outgoing operations (curl), and nanoseconds blocked on them |
Database and network work is counted where it happens: PDO and curl time
each statement and each transfer under --apm, and the count lands on the
route of the request that ran it. The table then gains two columns, statements
per request (q/req) and the share of the route’s wall time spent blocked on
the database or the network (wait) — the N+1 query and the slow upstream show
up there before anyone profiles. Timing costs two clock readings per statement
or transfer, never per function call.
The route is the request’s shape, as for per-route
profiling: GET /users/7 and
GET /users/8 are one row, GET /users/{id}, with no routing table consulted.
A method outside HTTP’s own (GET, HEAD, POST, PUT, DELETE, PATCH,
OPTIONS, CONNECT, TRACE) reads OTHER, since the client picks it.
A route is added to the table only once one of its requests is answered with
something other than 404, 405 or 410. Until then such an answer names no
route — the path served nothing — and is counted under one <not found> row:
a scanner’s thousand paths cost one row, not the table. A route already in the
table keeps its own “not found” answers, so a product page asked for an id that
does not exist shows in that route’s 4xx rate. Requests the server answers
before PHP runs (408 for a body that never arrives, 413 for one too large)
work the same way: counted under their route when the table has it, under one
<rejected> row otherwise, since any client can send them to any path. Asking
for a profile (the page’s “Capture a profile”, monitor <service>) changes none
of this.
New routes are also rationed: the table takes up to 64 at once, then one more a
minute, shared by every process of the service. A service’s routes appear in a
burst as traffic reaches them and rarely afterwards, while a scan of an
application that answers 200 to any path keeps inventing them; a request
beyond the ration is counted under <other>, and its route gets its row at a
later request. The table holds 255 shapes plus an <other> row; past that,
traffic is counted under <other> rather than dropped. A label longer than 63
bytes keeps its start and ends in ~ and a hash of the whole label, so two long
endpoints never share a row.
The table can be emptied when it filled with what nobody wants to watch:
elephc monitor 127.0.0.1:9411 --apm --reset-routesor Reset the route table in the Transactions section of the page (two clicks: the first arms it). Every route, its counters and its name go, and the table fills again from the next requests. The counters start a new run, which a collector reads as a restart, so nothing is counted twice and what it stored before keeps the old routes. A request running across the reset lands on its own route; samples the profiler took before it are shown without a route, their route ids belonging to the old table.
A request that takes its worker down — an uncaught exception, a fatal
error, exit, a --max-execution-time kill — never reaches its end, so it
cannot count itself. Each request is marked in flight in the shared counters,
and when the master reaps a worker that died serving one, it counts that
request as a 500, timed from its start to the reap. A worker that dies while
counting a request it answered is not counted again. With
--web-isolation=pool|request the web worker answers a handler that died with
a 500 itself, and that answer is what is counted. A web worker never dies of
PHP there, but it can be killed (by the kernel’s out-of-memory killer, say):
each request it waits on is marked in flight too, so the master counts every
one it was waiting on as a 500 when it reaps it.
Wall time stops at the handler’s return, before the body is compressed and written to the client. It is what the server spent, not what the client waited.
The service’s CPU and memory come with the counters. Each time the collector asks, the service’s master measures its whole process tree — itself, its workers, isolated handlers — and answers with four figures:
- CPU: user plus system time since the service started. A process’s time includes that of the children it has reaped, so a worker that dies does not take its CPU with it. A child reaped while the tree is being measured is caught by reading each parent again, so a recycled worker is counted neither zero times nor twice. A window shows the CPU spent during it.
- Cores: how many the service may run on — its CPU affinity, and on Linux its cgroup quota, so a container limited to two cores counts two. CPU is shown as a share of all of them: a 16-core service keeping two cores busy reads 12.5%, whatever machine it shares. Two services in one store add up, cores included. A quota is counted in whole cores, rounded down: a service allowed 1.5 CPUs counts one, and can read up to 150%, which the chart then shows rather than cutting at 100%.
- Memory: the live processes’ memory, added up so each page counts once:
a page shared by n processes counts 1/n in each. On Linux that is the
proportional set size (
smaps_rollup); on macOS the same sum is made from each memory region’s private and shared resident pages. Workers forked from one master share their copy-on-write pages; summing resident sizes — or macOS’s physical footprint, which charges a shared page to every process mapping it — would count those once per worker. Reading it walks each process’s mappings, so it is read every five seconds rather than every poll. - Processes: how many are alive, the master included.
Script runs carry none of this: a run’s own CPU and memory are in its profile.
Percentiles are the upper edge of the bucket they fall in. A bucket is never
wider than 1/8 of its lower edge, so a p95 of 4.6 ms means 95% of requests took
at most 4.6 ms and the true value is within 12.5% below it. No value is
interpolated: each one is a bound some ranked request actually respected.
All workers, and the handler processes of --web-isolation=pool|request, count
into one table in the shared mapping the master allocates before it forks, so a
single read covers the whole service.
What it costs
Recording a request is four relaxed atomic increments into a fixed table, plus
one clock reading at each end of the request. Once a route has been seen there
is no allocation and no lock; a test counts the allocations of the request path
and fails if there are any. Measured as retired instructions per request on the
cheapest route of a service (a 404 with no work behind it), the same binary
with and without --apm:
| instructions / request | |
|---|---|
without --apm | 648,343 (three runs: 645,623 – 653,067) |
with --apm | 651,122 (three runs: 649,606 – 652,327) |
That is about 2,800 instructions (0.4%), inside the run-to-run spread, on a request that does nothing else; on any route that does real work it does not register. The figures come from a debug build of the runtime, so they are an upper bound.
Reading the counters costs the service one handshake and one pass over the table per poll. It arms nothing: the sampler stays dormant.
Reading it
elephc monitor 127.0.0.1:9411 --apm --key shop.keytransactions since the service started — 555 requests over 20.8 s, 7 routes
service: CPU 4.2% of 18 cores (0.76 busy) · memory 13.0 MB · 3 processes
route req req/s mean p50 p95 p99 4xx 5xx time q/req wait
GET /products 102 4.9 135.0 ms 122.9 ms 213.0 ms 327.7 ms 0.0% 0.0% 91.9% 0.0 0.0%
POST /checkout 35 1.7 18.1 ms 18.4 ms 30.7 ms 41.0 ms 0.0% 0.0% 4.2% 0.0 0.0%
GET /products/{id} 204 9.8 1.4 ms 1.2 ms 3.8 ms 6.1 ms 13.2% 0.0% 2.0% 3.0 32.7%
GET /orders/{id} 102 4.9 1.9 ms 1.5 ms 2.8 ms 11.3 ms 0.0% 0.0% 1.3% 9.4 22.4%
GET /reports/{id} 103 5.0 785.1 µs 768.0 µs 1.2 ms 2.8 ms 0.0% 10.7% 0.5% 0.0 0.0%
<not found> 8 0.4 920.8 µs 224.0 µs 5.1 ms 5.1 ms 100.0% 0.0% 0.0% 0.8 17.2%
GET / 1 0.0 1.9 ms 1.9 ms 1.9 ms 1.9 ms 0.0% 0.0% 0.0% 0.0 0.0%
all routes 555 26.7 27.0 ms 1.3 ms 147.5 ms 213.0 ms 6.3% 2.0% 100.0% 2.8 0.9%
wall time from request head to handler return; percentiles are the upper edge of a latency bucket at most 12.5% wideThat is examples/web-apm under its demo load. Rows are ordered by share of
total wall time: the route at the top is the one where the service spends its
time, which is where an optimization pays, whether it is slow or merely busy.
Here the catalogue listing takes 92% of the service’s time while the payment
call, slower per request than most, takes 4%. The product page answers 404 for
an id that does not exist, and that shows in its own 4xx rate; the /old-page
links, which no route serves, are the <not found> row.
The key, the endpoint address and the transport (host:port, https://, a Unix
socket path) work exactly as for profiling a running
service.
Live, in the terminal
elephc monitor 127.0.0.1:9411 --apm --live --duration 5 --route "GET /products"The collector polls the service once a second; --live redraws the table for
the last --duration seconds (default 3), until Ctrl-C, followed by the trends
of the last minute — throughput and p95 per route as sparklines, with their peak
and worst value. Browsing a store shows the same trends over its span; here ten
minutes of the demo:
trends over the last 10 min (oldest → newest)

route               req/s                          peak  p95                           worst
GET /products       ▇▇▅█▄▇▆▆▇▄▆▅▅▆▄▆▄▆▆▅▆▄▆▄       19.6  ▅▅▅▅▅▆▅▅▆▆▆▆▆▇▇▆█▆▆▇██▇█    73.7 ms
POST /checkout      ▇▇▅█▄▇▆▆▇▄▆▅▅▆▄▆▄▆▆▅▆▄▆▄        6.5  ▇▇▇▇▇█▇▇▇██▇▇█▇▇█▇▇▇██▇█    18.4 ms
GET /products/{id}  ▇▇▅█▄▇▆▆▇▄▆▅▅▆▄▆▄▆▆▅▆▄▆▄       39.3  ▄▄▄▄▄▅▄▄▅▅▅▅▅▅▅▅█▅▅▅▅▅▅▆   512.0 µs
A stretch the collector did not see is a blank, not a zero. --route <label>
adds that route’s latency distribution, one row per power of two, every
request counted once:
latency of GET /products — 8484 requests

  16.4 ms – 32.8 ms   █                                             21   0.2%
  32.8 ms – 65.5 ms   ████████████████████████████████████████    8317  98.0%
  65.5 ms – 131.1 ms  █                                            142   1.7%
 131.1 ms – 262.1 ms  █                                              4   0.0%
The same view over a stored history, with no service and no browser:
elephc monitor --apm --store /var/lib/shop-apm --duration 86400 --route "GET /products"History on disk
elephc monitor 127.0.0.1:9411 --apm --store /var/lib/shop-apm --retention 14 --resolution 10--store <dir> keeps what the collector measured: one JSON line per
--resolution seconds (default 10), in one file per UTC day named
apm-YYYY-MM-DD.jsonl, and the collector deletes the days older than
--retention (default 7), by its own clock, when it starts and when a day
ends. Reading a store — browsing it, exporting from it — deletes nothing, and a
script run deletes old days only when given --retention itself, so a default
never cuts a collector’s longer history. Lines are appended whole, so a crash loses at most the line being
written, and a reader skips a torn line instead of failing the day. Only files
with that exact name pattern are ever read or deleted; anything else in the
directory is left alone. On Ctrl-C or SIGTERM the collector writes what it holds
before it exits.
Each line is one window (here from the demo, with one of its routes kept):
{"t":1794752059613,"span_ms":5999,"epoch":1794752015584868000,
 "routes":[{"route":"GET /products/{id}","n":94,"status":[0,47,0,47,0],"sum_ns":16591204,
            "hist":[[27,1],[28,2],[29,2],[30,3],[31,3],[32,4],[33,5],[34,4],[35,3],[36,1],
                    [37,3],[38,6],[39,1],[40,7],[41,12],[42,4],[43,5],[44,1],[45,7],[46,5],
                    [47,4],[48,6],[49,4],[73,1]]}]}
t is when the window ended (Unix milliseconds, by the collector’s clock: the
day files are named and pruned by it, so a remote service whose clock is off
still lands in the right day), epoch identifies the run of the service, and
hist lists the non-empty latency buckets.
Reading is incremental: a day file is parsed once, then only for what was appended since, however often the page refreshes. In what it keeps in memory, a day that is over has its windows folded by the minute — nothing reads a past day finer than that — and script runs of one transaction are folded by the minute too, so a cron line run every second does not fill the memory.
Restarts are followed. The service’s counters start from zero when it restarts, and its epoch changes; the collector notices and treats the new counters as the window since the restart, so nothing is counted twice and nothing negative is recorded. A collector that cannot reach the service keeps retrying every second and says so, once, until it answers again.
One collector per service and store. A collector claims its service in the
store (a .collector-<address>-<hash>.lock file); a second one for the same service
is refused, because it would write the same requests again and double every
count. Collectors of different services, and script runs, share a store: each
window records the service it came from, rates count the time covered once
however many services covered it, a view holding several services names their
routes service · route, and a collector’s live page reads only its own
service’s history.
On the monitor page
elephc monitor 127.0.0.1:9411 --apm --store /var/lib/shop-apm --serve 127.0.0.1:9000--serve <host:port> serves the monitor page — the same page --html writes
for a profile — with a Transactions | Profile switch in its header. The
switch exists only with --apm; without it the page is the call graph alone.
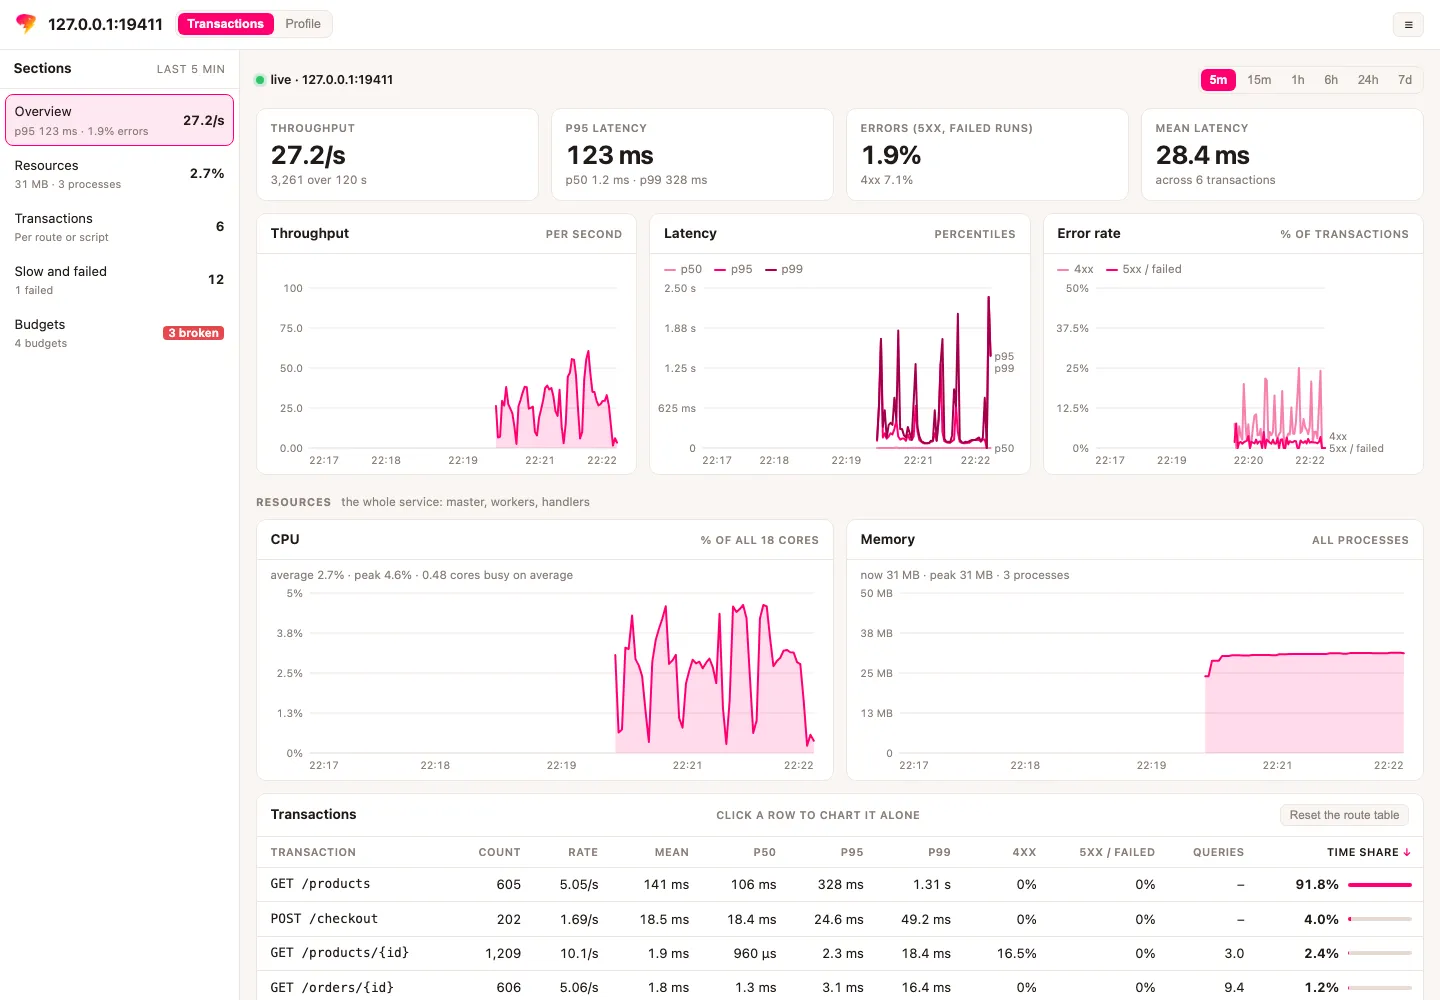
Transactions shows, over the chosen range (5 minutes to 7 days), with a sidebar of its sections — each with its headline figure, the one in view selected, a click away:
- Overview: tiles for throughput, p95 and mean latency, and the error rate; three charts: transactions per second, p50/p95/p99 latency, and the 4xx and 5xx rates;
- Resources: the service’s CPU, as a share of all its cores, and its memory, with their average, peak and current value;
- Transactions: the table, sortable; clicking a row narrows the tiles and charts to it, and the URL keeps the selection;
- Slow and failed requests, when the collector captures them;
- Budgets, when the collector checks them: each rule in columns — its state, the metric, the route, the budget, the value now and since when — the sidebar says how many are broken.
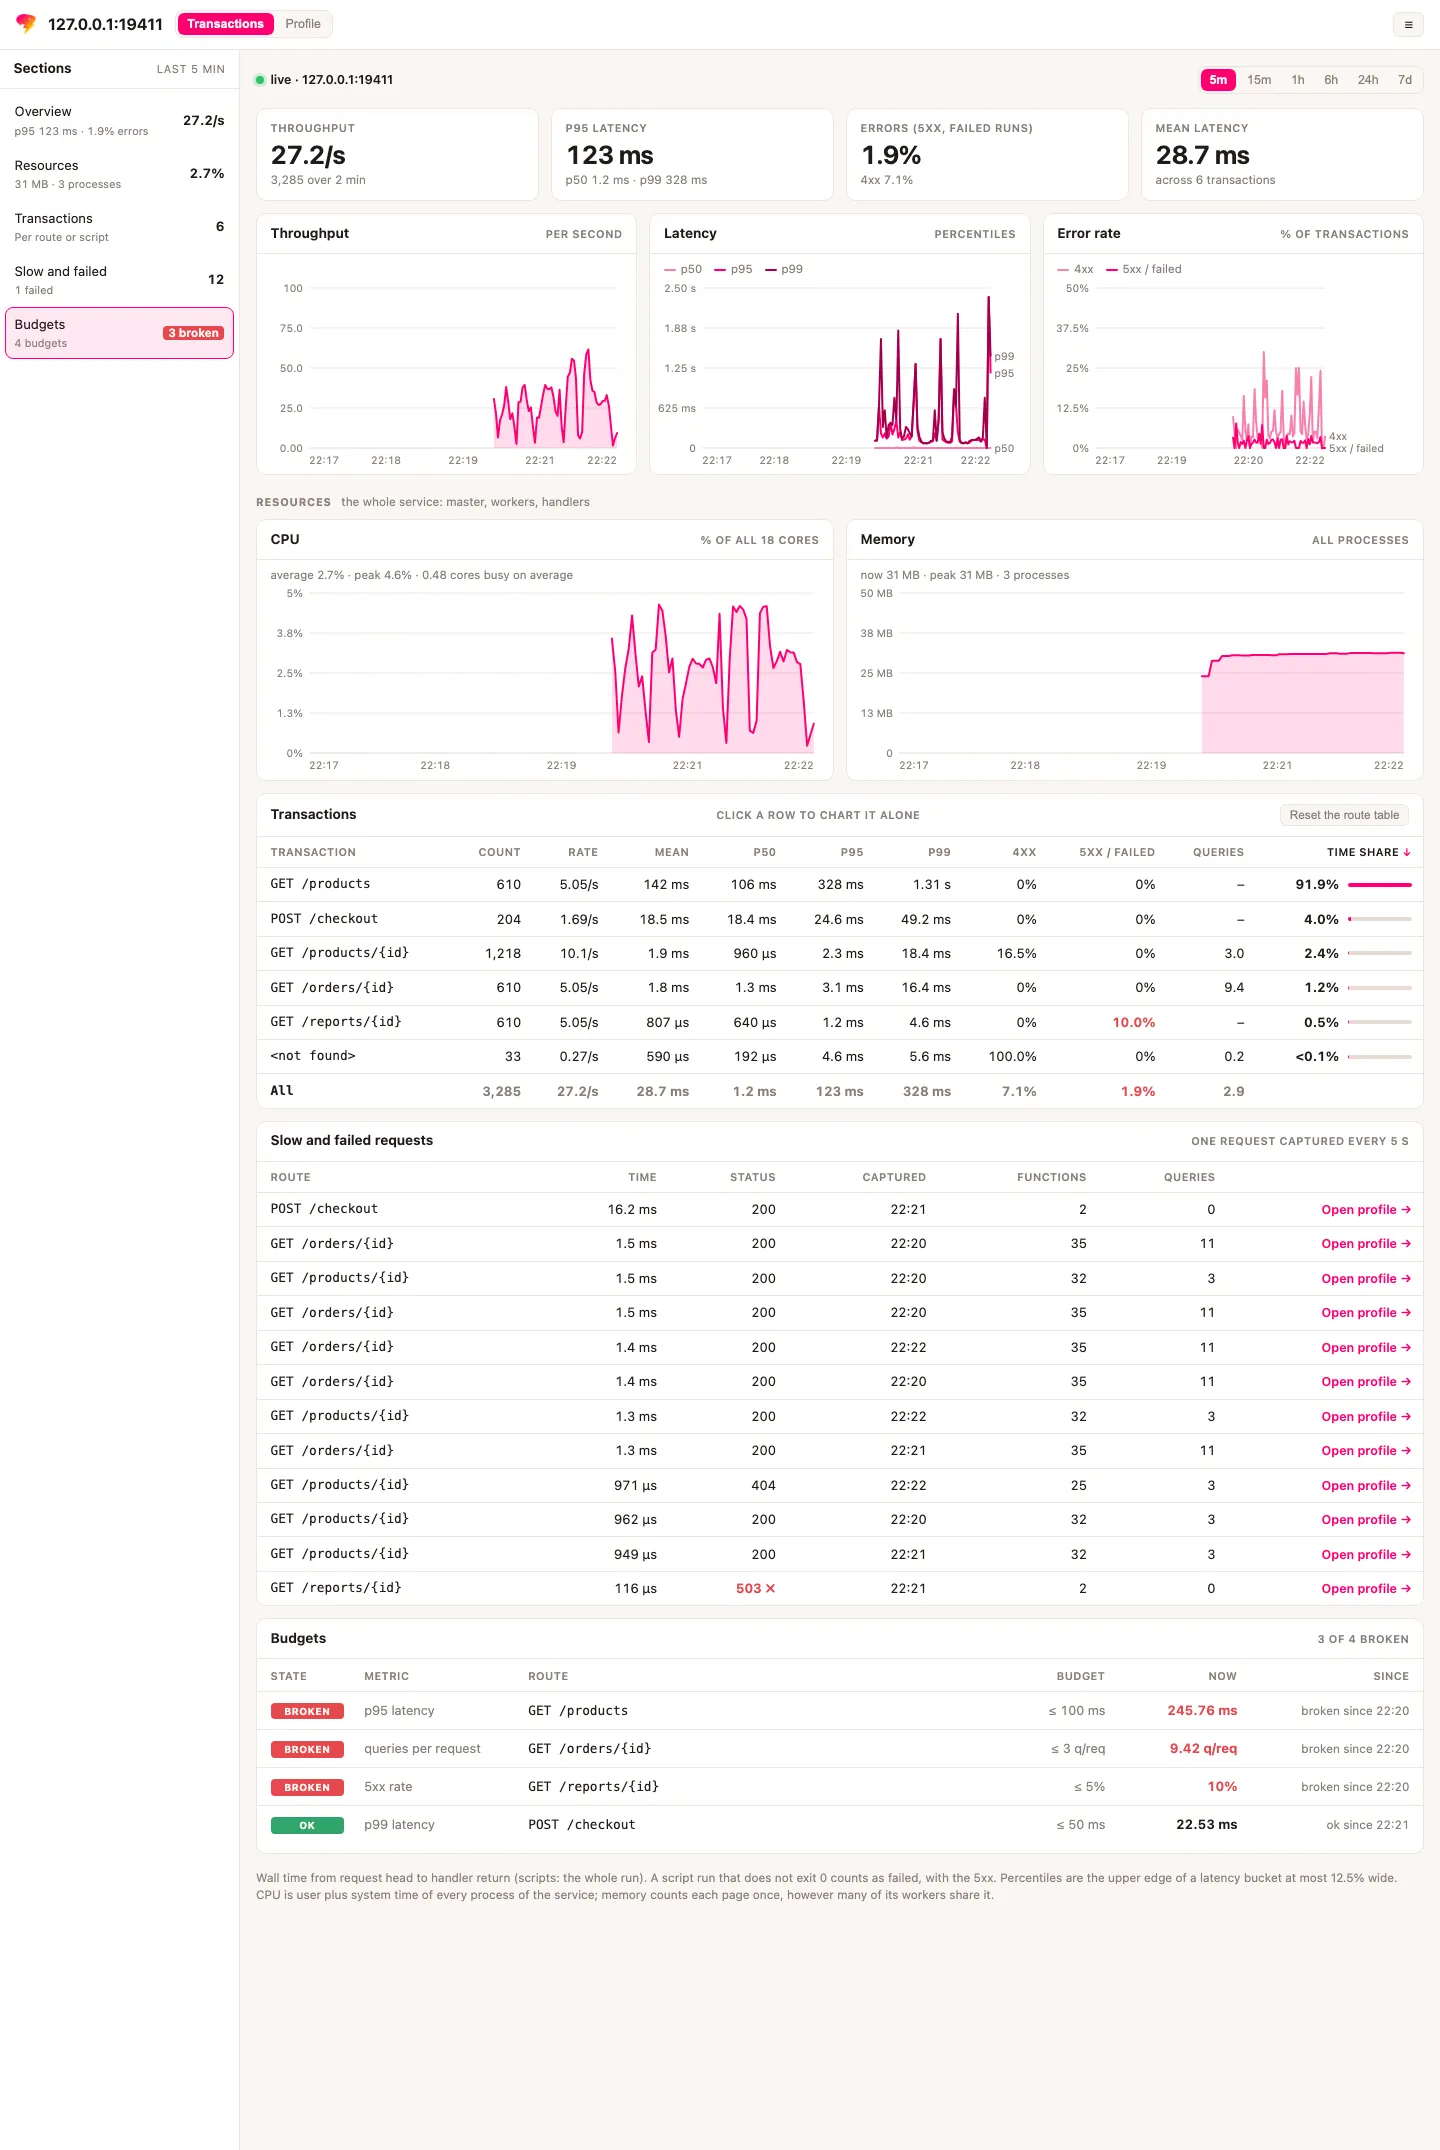
These screenshots are a real run of examples/web-apm, photographed by
scripts/docs/apm_screenshots.sh — run it to regenerate them after a change
to the page. The range rides in the link (#at=300 for five minutes), as the
selected route does (#ar=…), so a shared link opens the same view.
It updates when a new window arrives (server-sent events) rather than on a
timer of its own, follows the page’s light or dark theme, and loads nothing from
the network. The last hour comes from memory at one-second resolution; longer
ranges come from the store at its resolution, so --serve without --store
shows at most an hour.
Profile is the call graph of the service. It starts empty — the service’s
sampler stays dormant until someone asks — and Capture a profile asks, as
monitor <address> does: the service starts sampling its CPU, the page waits
three seconds and shows the result, routes at the root. The sampler then stays
armed for the life of the service, as after any ask. The last ten captures are
kept.
The same server answers GET /metrics with the latest counters in the
Prometheus text format — elephc_apm_requests_total{route,class}, the
elephc_apm_request_duration_seconds histogram, elephc_apm_cpu_seconds_total,
elephc_apm_memory_bytes, elephc_apm_cpu_cores and elephc_apm_processes — for a Prometheus or Grafana
already in place. Its le buckets count only the requests whose bucket ends at
or below the boundary, so a boundary inside a bucket undercounts rather than
claiming a request might have been faster than it was.
Bind a loopback address unless you mean to publish your routes and their timings: like the live call graph, this server has no authentication. Put it behind a proxy that does if it must be reachable. Bound to loopback, it answers only requests addressed to a loopback name on its port, so a web page that rebinds its own name to 127.0.0.1 gets nothing. Capturing a profile changes the service, so it takes a POST from the page’s own origin: a link or an image on another site cannot trigger it. It reads at most 16 KiB of request head, which must arrive within ten seconds, and serves 64 connections at once; a client that stops reading is dropped after ten seconds, and an open page’s event stream is renewed every five minutes, so a vanished browser never keeps a slot.
With no service at all, the stored history can still be browsed on the page:
elephc monitor --apm --store /var/lib/shop-apm --serve 127.0.0.1:9000Slow and failed requests, profiled
elephc monitor 127.0.0.1:9411 --apm --store /var/lib/shop-apm --serve 127.0.0.1:9000 --capture-every 5The table says which route is slow; --capture-every <seconds> keeps the
evidence of why. Every that many seconds the collector asks the service for
the exact profile of its next request to complete — the same exact capture
monitor <address> --exact takes — and keeps, for each route, the five slowest
captures, failed or not, and its five most recent failures (a 5xx). Each profile records the
request’s route and HTTP status beside its call graph.
On the page, Slow and failed requests lists them, slowest first, under the
transactions table (narrowed to a route when one is selected); Open profile
shows that request’s exact call graph in the Profile view, with the flame view,
the queries panel and every measured dimension. With --live, the terminal
lists them under the trends:
captured requests — 11 kept, slowest first

     1.1 ms   200  GET /orders/{id}
     1.1 ms   200  GET /orders/{id}
     1.0 ms   200  GET /orders/{id}
     1.0 ms   200  GET /orders/{id}
   999.1 µs   200  GET /orders/{id}
   810.8 µs   404  GET /products/{id}
   760.8 µs   404  GET /products/{id}
   752.5 µs   404  GET /products/{id}
(Twenty seconds of the demo: the routes that complete most often are the ones captured first; a slow route’s requests turn up as the stream goes on.)
The cost is one exact request per period, whatever the traffic: about 30 ns per
function call of that one request, and nothing on the others. Without
--capture-every nothing is captured, and the card on the page says how to turn
it on. Capturing is the collector’s work: on a one-shot read (no --live,
--store or --serve) the flag is refused rather than ignored.
Budgets and alerts
elephc monitor 127.0.0.1:9411 --apm --store /var/lib/shop-apm --serve 127.0.0.1:9000 \
    --alert 'p95:GET /products<=100' --alert 'queries:GET /orders/{id}<=3' \
    --alert 'error_pct:*<=1' --alert-exec 'curl -s -X POST -d "$ELEPHC_ALERT_STATE $ELEPHC_ALERT_RULE" https://hooks.example/elephc'
--alert states a budget the way --assert
does — <metric>:<route><op><value>, * for every route together — over the
transaction metrics: p50, p95, p99 and mean in milliseconds,
error_pct (5xx and failed runs) and client_error_pct (4xx) in percent,
rps, and queries per request. A collector checks every budget after each
poll over the last --alert-window seconds (default 60, at most 3600: the hour
the collector keeps in memory), so a single slow request does not trip one and
a sustained regression does. Only the windows that lie in that span count: the
first window after the service was unreachable spans the whole outage, and is
not judged as the last minute. A route with no traffic in the window keeps its
state: silence is neither a recovery nor an incident — except for rps, where
no request is the measurement: a floor such as rps:*>=1 fires when traffic
stops, and when the service stops answering, since the budgets are still
checked every second while it does not.
When a budget starts or stops being broken, the collector says so on stderr and
runs --alert-exec through sh -c, without waiting for it, with
ELEPHC_ALERT_STATE (firing or resolved), ELEPHC_ALERT_RULE,
ELEPHC_ALERT_VALUE and ELEPHC_ALERT_TARGET in its environment: a webhook,
a chat message or a pager is one command, and no notification service lives in
the compiler. Under --live on a terminal the hook’s own output is discarded,
since it would land in the middle of the redrawn table. The page lists every
budget in its Budgets section, broken ones first, and --live lists them under
the table. --alert-exec and --alert-window act in the collector: on a
one-shot read they are refused rather than ignored.
Without a collector, the budgets are checked once, over everything the service counted since it started, and a broken one makes the command exit 2 — a gate a deploy pipeline can run after its smoke traffic:
budgets — 2 of 4 broken over the last 11 min

  ✗ broken  p95:GET /products<=100                   163.84ms
  ✗ broken  queries:GET /orders/{id}<=3              9.40 q/req
  ✓ ok      error_pct:*<=5                           1.86%
  · idle    p99:GET /missing<=10                     no traffic
Scripts and console commands
A script has no requests; its transaction is the run. monitor launches it
under the exact profiler, as it always does, and with --apm also records the
run:
elephc monitor bin/console --apm --store /var/lib/shop-apm -- app:import rows.csvthis run: 163.4 ms, exit 0
CLI console app:import — 9 runs over 33 min
runs mean p50 p95 p99 failed q/run wait
9 169.6 ms 180.2 ms 196.6 ms 196.6 ms 0.0% 0.0 0.0%
last 9 runs (oldest → newest)
▇█▇▇▇▇▇█▇
latency of CLI console app:import — 9 runs
131.1 ms – 262.1 ms ████████████████████████████████████████ 9 100.0%From five runs on, the runs’ latency distribution follows; failed runs are
marked ✗ under the trend.
- The name is
CLI <script>, plus the console command when the first argument after--reads as one (app:import,cache:clear,migrate). Anything else there — a path, an id, a date, a file name — is data, and is left out so it cannot split the history into one row per value. - A run that does not exit 0 failed, and counts in the error rate with the 5xx. A run that dies before writing a profile is still recorded.
- The time is the process’s, from launch to exit, measured by
monitor. - Database and network work — statements, outgoing operations and the time blocked on them — come from the run’s exact capture, and show as queries per run and wait share.
monitorexits with the script’s own code when the script fails (or 128 plus the signal that killed it), and 0 when it succeeds — a run that left no profile included — so a cron line can be wrapped in it and still fail when the job does. Two codes aremonitor’s own: 2 when a budget given with--assertor--fail-on-regressionis broken, and 1 when it cannot write an export it was asked for. Under--apmnothing is exported unless asked: the Speedscope filemonitorotherwise writes next to the program is written only with--out, so a wrapped cron line leaves no file behind and cannot fail on one.
Arguments after -- go to the script. With --store the run joins the history
and the table covers every stored run of that transaction; without it, the
table is the run alone. The runs are also in the Transactions view of the page,
next to the service’s routes when they share a store, and --html writes the
run’s profile with that view embedded:
elephc monitor bin/console --apm --store /var/lib/shop-apm --html import.html -- app:importThe exported page holds every stored transaction and the series of the busiest twenty, so its table and route filter work offline. Rates of script runs are counted over the time the runs spread across, and read per minute or per hour when they are that rare.
Beyond HTTP: messages, library calls, named boundaries
A transaction is one entry into compiled code. A web request is one; so is a message a consumer handles, a call an application makes into a library elephc built, or a call of a method you name. All of them are counted the same way — count, latency percentiles, failures, queries — and share the table, the history, the budgets and the page, where chips above the table show one kind at a time.
| Kind | Named | Failed when |
|---|---|---|
| A Symfony Messenger message | MSG App\Message\SendEmail | its handling failed (the worker reported it) |
| A call into a library export | CALL render | the call returned a non-zero status |
A method or function given to --apm-transaction | TXN App\Jobs\Import::run | an exception left it |
A script run, launched by monitor or built with --apm-collector | CLI console app:import | it did not exit 0 (an exit() inside a transaction ends it with that status) |
A transaction that starts inside another — a message dispatched synchronously during a web request, an export a host calls from a callback — is part of the outer one and counts nothing of its own.
Building for it
--with-apm carries transaction monitoring without the profiler: no
instrumentation, no sampling signal, nothing a host application would not
expect of a library. --with-monitoring carries it too, with the profiler.
# A consumer that sends what it counts to a collector.
elephc --with-apm --apm-collector 10.0.0.5:9412 bin/console.php

# A library for an iOS application, counting every call the app makes into it.
elephc --emit staticlib --target ios-arm64 --with-apm \
    --apm-collector 192.168.1.20:9412 Renderer.php

# A job loop whose iterations are what matters.
elephc --with-apm --apm-collector 10.0.0.5:9412 \
--apm-transaction 'App\Jobs\Importer::importBatch' worker.php- Messenger’s messages need nothing: in a build that counts transactions,
Worker::handleMessageis a transaction named after the message’s class, and theWorkerMessageFailedEventthe worker builds for a failure marks it failed. Neither the application nor its vendors are changed. --apm-transaction Class::method(or a function name; repeatable) makes each call of that method a transaction of its own. A trait’s method is named by its trait (Trait::method), and counts in every class that uses it. A name that is not declared in the program is reported as a warning.- A library’s exports are counted from
elephc_initon: every call the host makes through the C ABI is a transaction named after the export.
Sending to a collector
A program built with --apm-collector HOST:PORT sends its counters there
instead of waiting to be read — an application on a phone, a library in its
host, a consumer nothing can connect to. Counting starts with the program;
the address is part of the build, never of its environment.
elephc monitor --apm --listen 0.0.0.0:9412 --key console.key \
--store /var/lib/shop-apm --serve 127.0.0.1:9000- Both sides prove the build key before a byte of counters is sent: the program sends to a holder of the key only, and the collector keeps what a holder of the key sent only. The counters travel encrypted, each send under keys of its own.
- Every five seconds, and once more at exit, the program sends its counters
— cumulative, so a lost connection loses nothing: the program reconnects and
the next send carries everything since. A run shorter than that is sent
whole as it exits,
exit()and an uncaught exception included. - Each program is a source of its own, named after it, the address it sent
from, its pid and a number it draws at start (
[email protected] pid 1 #3fa2c1d0), so two containers running one build as pid 1 behind one address stay apart; their transactions share the history and the page. - A collector restarted while a program runs starts counting that program from its next send, as one reading a service starts from its first poll.
- Each program’s history stays its own: stored records, the page and
/metrics(asourcelabel per program) never merge two programs’ counts. - A listening collector serves up to 256 programs at once; a connection that has not proven the key within five seconds is closed. A program silent for ten minutes is forgotten, and one silent for fifteen seconds is time in which no transaction was seen — a throughput budget fires when the last consumer dies.
- A
--webservice built with a collector records its requests from the start,--apmor not: the build already counts and sends.
A collector that receives can neither capture requests nor reset a route
table — nothing can be asked of a program that only sends — so --listen
refuses --capture-every and --reset-routes, and the page offers neither.
Limits
- Script runs are recorded through
monitor, or by a build that names its collector with--apm-collector. A script started any other way records nothing: its argv belongs to PHP, so there is no--apmit could take, and an environment variable never turns monitoring on. - A library counts from
elephc_inittoelephc_shutdown. One the host never initializes counts nothing; its shutdown sends the last counts and stops the sending thread, so the host may unload it afterwards, and a laterelephc_initstarts sending again. A library is followed through its collector only: it opens noELEPHC_PROBE_ADDRendpoint. A static library’s host linkslibelephc_probe.awith the other bridge archives. - A program hosting PHP extensions sends at exit what it counted up to its last periodic send: the extensions’ shutdown has the exit hook.
- Captures are of requests as they come. A request’s duration and status
are known only once it ends, so
--capture-everyprofiles the next request each time and keeps what turned out slow or failed; a rare slow request is caught in proportion to how often it happens. Profile one on purpose with--exactor a signedX-Elephc-Queryheader. - Route shapes are the server’s. Two endpoints whose paths differ only in an identifier share a row, by design; endpoints the shaper cannot tell apart any other way do too.
- The route table empties only when asked. Its 255 rows last as long as
the service; the new-route ration only slows a scan of an application that
answers every path. An application that serves arbitrary paths with
200for hours on end will, in the end, count new paths under<other>until--reset-routesempties the table. - In-flight requests are tracked up to 1 024 at once over the whole service; past that, a request whose process dies is not counted.